- Embedded UI components - Embed Layer’s charts and report UI components within your experience.
- API - Call Layer’s API directly to build your own accounting reports.
Embedded components
Layer provides a variety of chart and table report UI components that you can download via npm and embed directly within your frontend. Below are some examples: Profit & Loss chart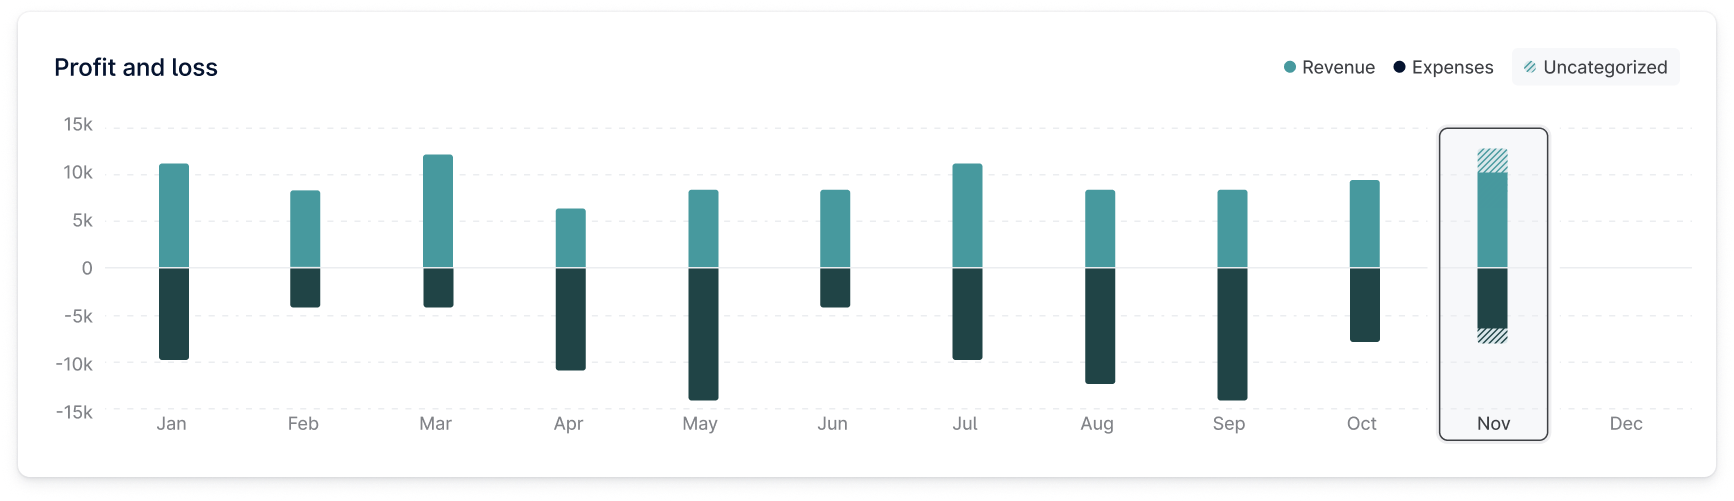
API
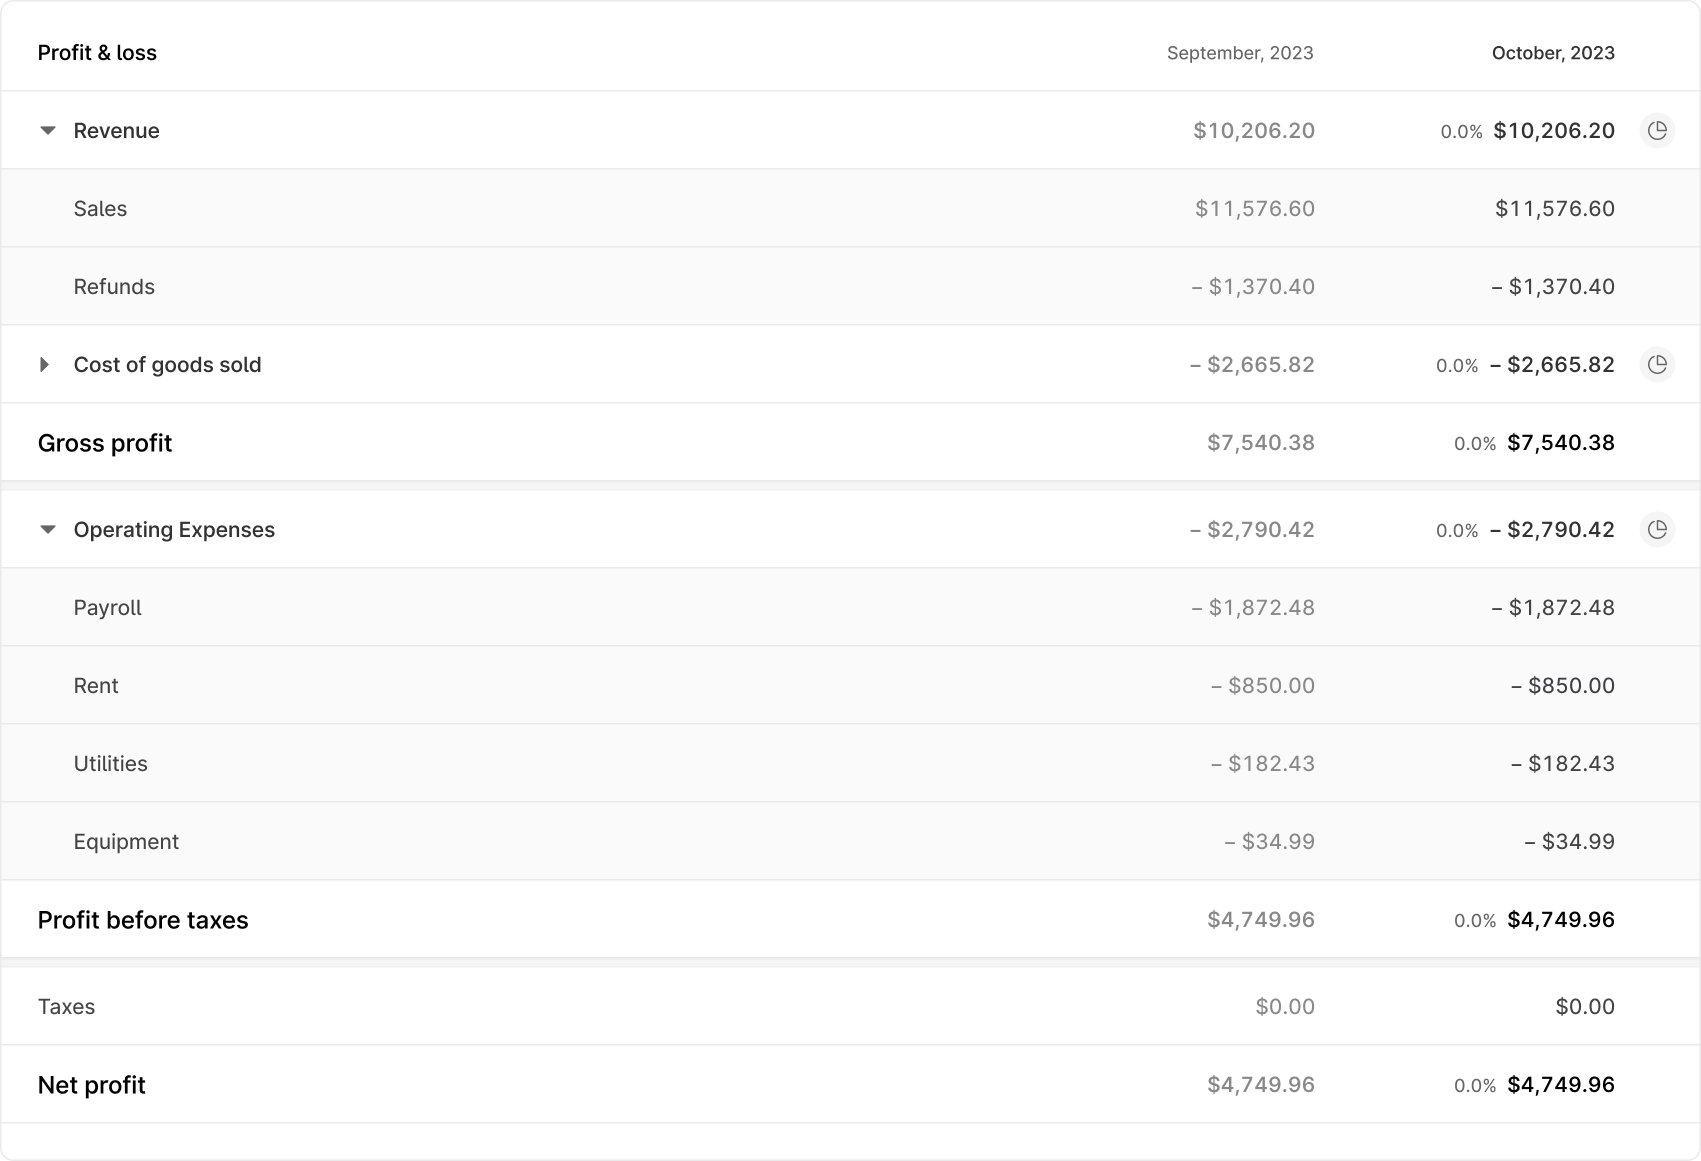
Retrieving a Profit & Loss report
To build your own Profit & Loss report UI make a call to the retrieve a Profit and Loss Report endpoint.The start_date query string parameter is required for all calls to the Retrieve a Profit and Loss Report endpoint.
Request
Response